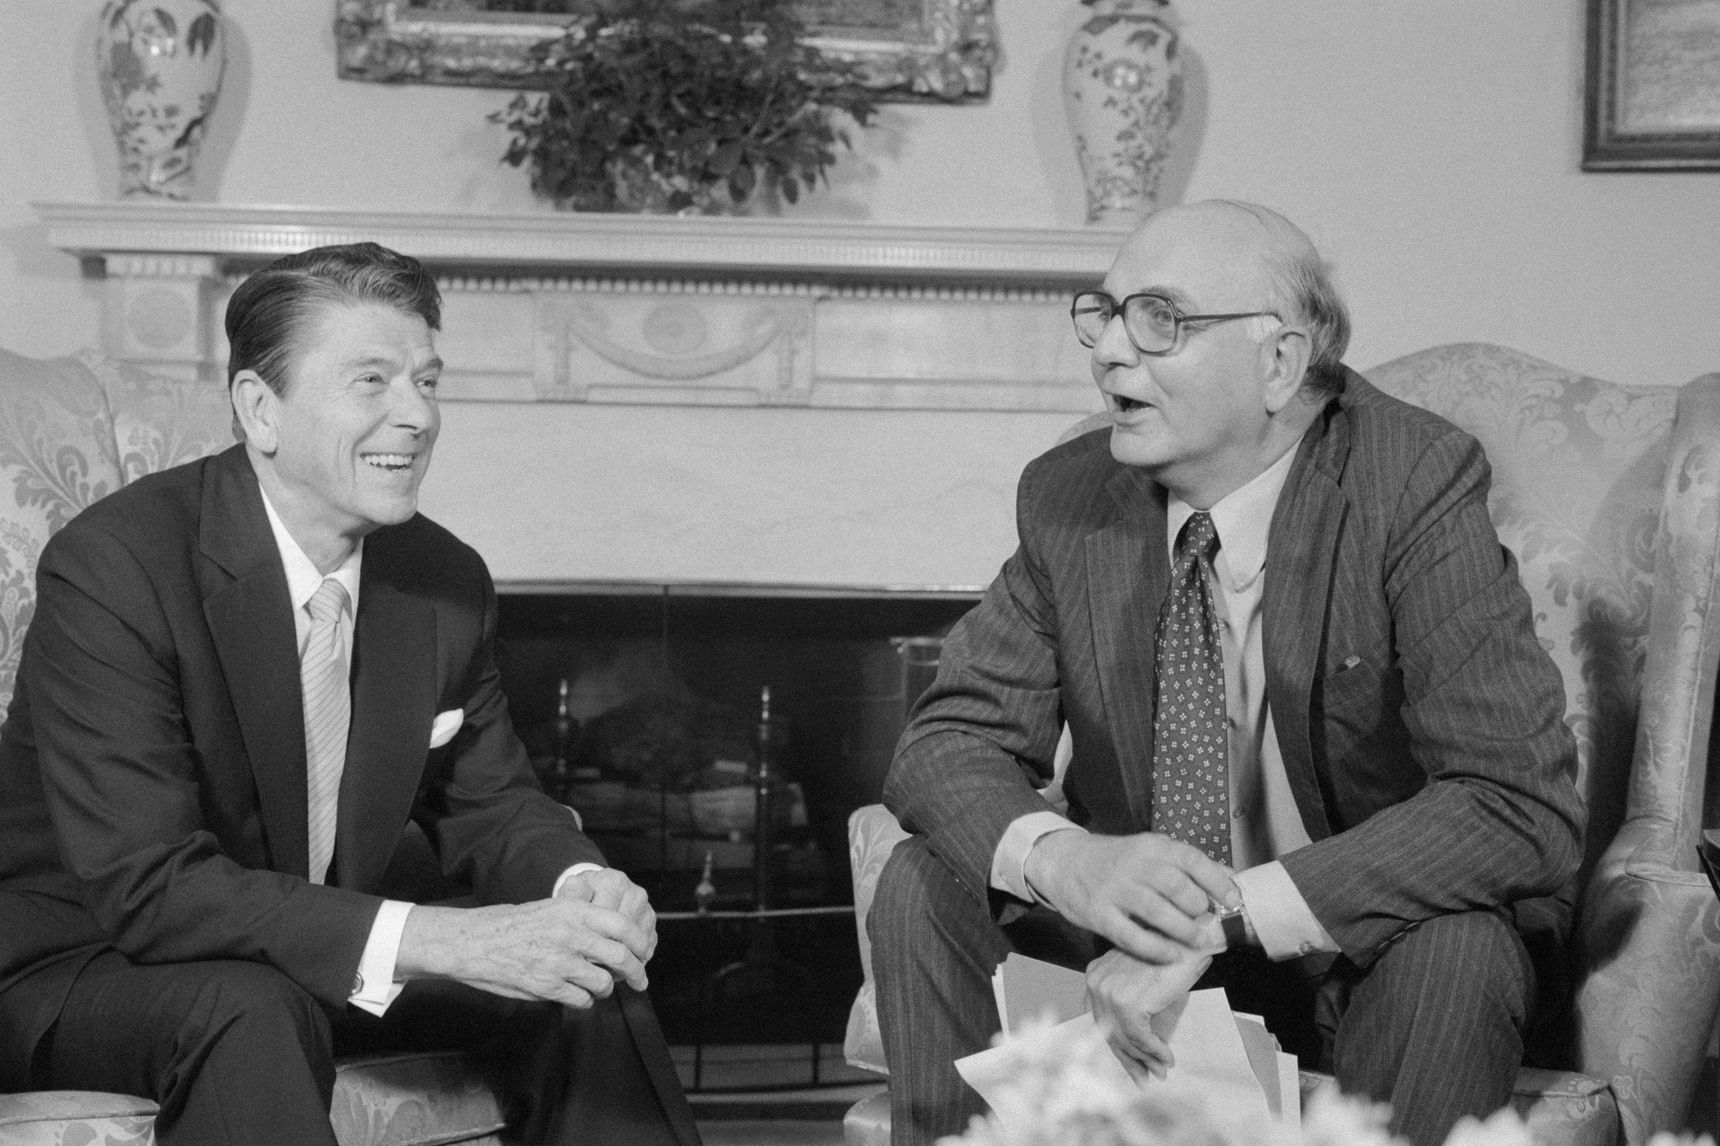
Former Federal Reserve Chairman, Paul Volcker, will be remembered for many policy decisions that still outlive his tenure. More specifically, the lessons learned from his handling of the Great Inflation of 1973-81 will be amongst the most relevant.
As we live through a similar economic challenge today, it is important to remember the role that government plays managing inflation. Knowing what government can do, helps us understand the limitations as well. The current divisive political times can create an additional barrier to get structural policy changes implemented, but if there is something we learned from the Volcker era, is that actions have consequences when it comes to monetary policy. Knowing what it is been done to fight inflation can shed some light into what might come next.
The curated article below, published by the Wall Street Journal, provides important context to the measures and reactions that both the Federal Reserve and Congress did to counter the inflationary pressures suffered during 1973-81 and it compares them to today’s actions.
Source: Lessons From the Great Inflation of 1973-81, The Wall Street Journal, August 2nd, 2022
Lessons From the Great Inflation of 1973-81
Then as now, what drove higher prices was excess demand owing to runaway government spending. Ronald Reagan and Paul Volcker understood.
By and
History withholds its wisdom from those who ignore its lessons. Forty years ago this month, the fiscal policy of President Ronald Reagan and the monetary policy of Federal Reserve Chairman Paul Volcker broke the back of the 20th century’s most destructive inflation, ushered in an economic expansion that effectively lasted a quarter of a century, and banished inflation—until now.
The buildup to the Great Inflation started in 1966, when Congress, at the urging of the Johnson administration, expanded funding for both the war in Vietnam and the War on Poverty. This “guns and butter” policy produced a double-digit surge in federal spending. By 1973 inflation was running at 8.7% and would average 9.2% for nine years—far surpassing average inflation of 3.3% between 1946 and 1972 and 2.7% from 1982 through 2019. During the 1973-81 Great Inflation, even after adjusting for inflation, federal revenue rose by an average 4.1% a year. The share of the economy taken by the federal government in taxes rose by nearly one-eighth, from 17% to 19.1%.
That’s astonishing, because Congress never voted to raise income taxes during that period. In fact, after LBJ’s 1968 temporary tax surcharge, which didn’t slow inflation, Congress cut federal income taxes in 1971, 1975, 1976 and 1977. So how did taxes rise at a record pace? Surreptitiously and automatically through inflation and bracket creep. As the Congressional Budget Office explained in 1980, “taxpayers with two dependents . . . earning $15,000”—around $57,000 in 2022 dollars—“and filing a joint return would pay $294 more in federal income taxes—a 23.8% rise in tax liability—if the family’s adjusted gross income and itemized deductions rose by 13.3%,” the inflation rate of 1979. With 16 tax brackets and 9% inflation over the period, bracket creep increased taxes as a share of gross domestic product by 2.1%, dwarfing the later Clinton and Obama tax increases combined.
But record tax increases couldn’t keep pace with spending. Annual real federal spending increased by 4.3%, defense fell by 0.1%, and social spending exploded by 6.3%. As a share of GDP, total spending rose by 2.6%, defense fell by 1.5%, and social spending rose by 4.1%, almost a one-third increase in the share of national income being spent by the federal government on social spending. Compare that with the New Deal: Social spending rose by a then-unheard-of 2% of GDP from 1933 through 1939.
Guns and butter ignited excess demand and inflation in 1966, but butter has fueled excess demand and inflation ever since. Monetary policy has accommodated these fiscal excesses; and supply disruptions, including those caused by the six-month Arab oil embargo in 1973 and the pandemic shutdown in 2020, exacerbated them. But federal spending has driven inflation in postwar America.
When Reagan took office in January 1981, the inflation rate was 12.5%. The tax burden and the level of federal spending were both postwar highs, respectively 19.1% and 21.6% of GDP. By the end of the Reagan presidency, real average annual federal spending growth had declined to 2.5% from 4.3% and social spending growth to 1.9% from 6.3%. Real annual defense spending growth had risen to 4.3% from minus 0.1%. As a share of the economy, total federal spending had fallen by 1% and social spending by 1.5%; defense spending had risen by 0.5%.
Reagan achieved this spending restraint during a deep recession, which saw unemployment rise to 10%. The Federal Reserve’s tightening sent prime interest rates to 20.5% in 1981. Neither Reagan nor Volcker ever flinched. In addition to dramatically reducing the real growth in government spending and excess demand, Reagan cut taxes, creating incentives to work, save and invest. Congress indexed individual tax brackets for inflation beginning in 1985. Reagan built on Jimmy Carter’s transformational deregulation effort, completing the decontrol of oil and gas prices and further lightening regulatory burdens across the economy. Those efforts cut the costs of moving people and products by 50% and gave America the world’s most efficient supply chain.
In conjunction with Fed monetary tightening, cutting spending, taxes and the regulatory burden brought inflation down quickly. By fall 1982, inflation had been cut in half, and by the end of Reagan’s first term it was reduced to normal levels, where it remained until the 2020s.
With the sharp drop in the inflation rate, bracket-creep revenue the CBO had assumed would be generated in 1982-84 failed to materialize. The drop in inflation alone reduced bracket-creep tax increases by $108 billion in those three years. The double-dip recessions of 1980-82 slashed revenue by another $184 billion. According to CBO, the plummeting of inflation and the 1980-82 recessions cost the Treasury $292 billion, more than the static cost estimate of $280 billion for the Reagan tax cuts during 1982-84. The Reagan tax cut reduced the tax burden from 19.1% of GDP to 17.8% in eight years, reversing 68.5% of the nine-year bracket-creep tax increases. By 1984 runaway inflation was over, real GDP growth hit 7.2%, and it was “Morning in America.” The economic recovery effectively lasted 25 years, until the Great Recession of 2007-09.
During the pandemic, total federal spending exploded as government spent in two years what it had spent in the three years before the pandemic. The Federal Reserve accommodated this fiscal explosion by buying or offsetting three-fourths of all the government debt incurred. The money supply expanded at the fastest rate in postwar history.
With inflation running at 9.1% and negative growth for the past two quarters, President Biden continues to press for massive increases in taxes and spending. Even though stimulus spending has ended, the Biden budget for fiscal 2023 calls for spending 30.2% more than the pre-pandemic 2019 nominal level. By executive order, regulatory appointments and antitrust actions, Mr. Biden has imposed the nation’s heaviest peacetime regulatory burden. He continues to attack big oil, big banks, big tech and big grocers and continues to search for price fixing, all policies that failed in the 1970s.
Mr. Biden is pursuing policies that are the exact opposite of the policies Reagan used to stop the inflation and revive the economy. Mr. Biden may think he can tax, spend and regulate America out of the inflation and recession. History suggests otherwise.
Mr. Gramm is a former chairman of the Senate Banking Committee and a nonresident senior fellow at American Enterprise Institute. Mr. Solon is a partner of US Policy Metrics.
Originally published by the Wall Street Journal on Aug. 2, 2022
Source: Lessons From the Great Inflation of 1973-81, The Wall Street Journal, August 2nd, 2022


